(from github.com/abolotnov)
This is now far it went with 1000 web crawlers and max_access=24 for each:
Looks like after 100th crawler or so, it will not crawl for further web crawlers. Has anyone tried using many crawlers?
(from github.com/abolotnov)
This is now far it went with 1000 web crawlers and max_access=24 for each:
(from github.com/abolotnov)
I dumped the 1000 web crawlers in here: https://gist.github.com/abolotnov/5ac96731651300c248807b021c183718
let me know how else I can help nail this down.
(from github.com/abolotnov)
full crawler log here: https://gist.github.com/abolotnov/09bc44869f0dc0672992f3491e52db15
looks like at start it only picks up a portion of the crawlers, not all 1000
(from github.com/marevol)
Change the following value in fess_config.properties:
page.web.config.max.fetch.size=100
(from github.com/abolotnov)
this could be it, I will try and report back! Thanks a lot.
(from github.com/abolotnov)
After changing the config and restarting FESS, is there anything else I need to do before I start the Default Crawler.
I changed the page.web.config.max.fetch.size to 10000 and after I restarted FESS and then started the crawler, I can see the config has picked up additional sites:
...

2019-01-28 20:51:05,110 [WebFsCrawler] INFO  Target URL: http://www.gapinc.com/
2019-01-28 20:51:05,110 [WebFsCrawler] INFO  Included URL: http://www.gapinc.com/.*
2019-01-28 20:51:05,110 [WebFsCrawler] INFO  Included URL: https://www.gapinc.com/.*
2019-01-28 20:51:05,110 [WebFsCrawler] INFO  Excluded URL: .*\.gif .*\.jpg .*\.jpeg .*\.jpe .*\.pcx .*\.png .*\.tiff .*\.bmp .*\.ics .*\.msg .*\.css .*\.js
2019-01-28 20:51:05,121 [WebFsCrawler] INFO  Target URL: http://www.grifols.com/
2019-01-28 20:51:05,121 [WebFsCrawler] INFO  Included URL: http://www.grifols.com/.*
2019-01-28 20:51:05,122 [WebFsCrawler] INFO  Included URL: https://www.grifols.com/.*
2019-01-28 20:51:05,122 [WebFsCrawler] INFO  Excluded URL: .*\.gif .*\.jpg .*\.jpeg .*\.jpe .*\.pcx .*\.png .*\.tiff .*\.bmp .*\.ics .*\.msg .*\.css .*\.js
2019-01-28 20:51:05,132 [WebFsCrawler] INFO  Target URL: http://www.garmin.com/
2019-01-28 20:51:05,132 [WebFsCrawler] INFO  Included URL: http://www.garmin.com/.*
2019-01-28 20:51:05,132 [WebFsCrawler] INFO  Included URL: https://www.garmin.com/.*
2019-01-28 20:51:05,132 [WebFsCrawler] INFO  Excluded URL: .*\.gif .*\.jpg .*\.jpeg .*\.jpe .*\.pcx .*\.png .*\.tiff .*\.bmp .*\.ics .*\.msg .*\.css .*\.js
...
But after working for some time, it again stopped:
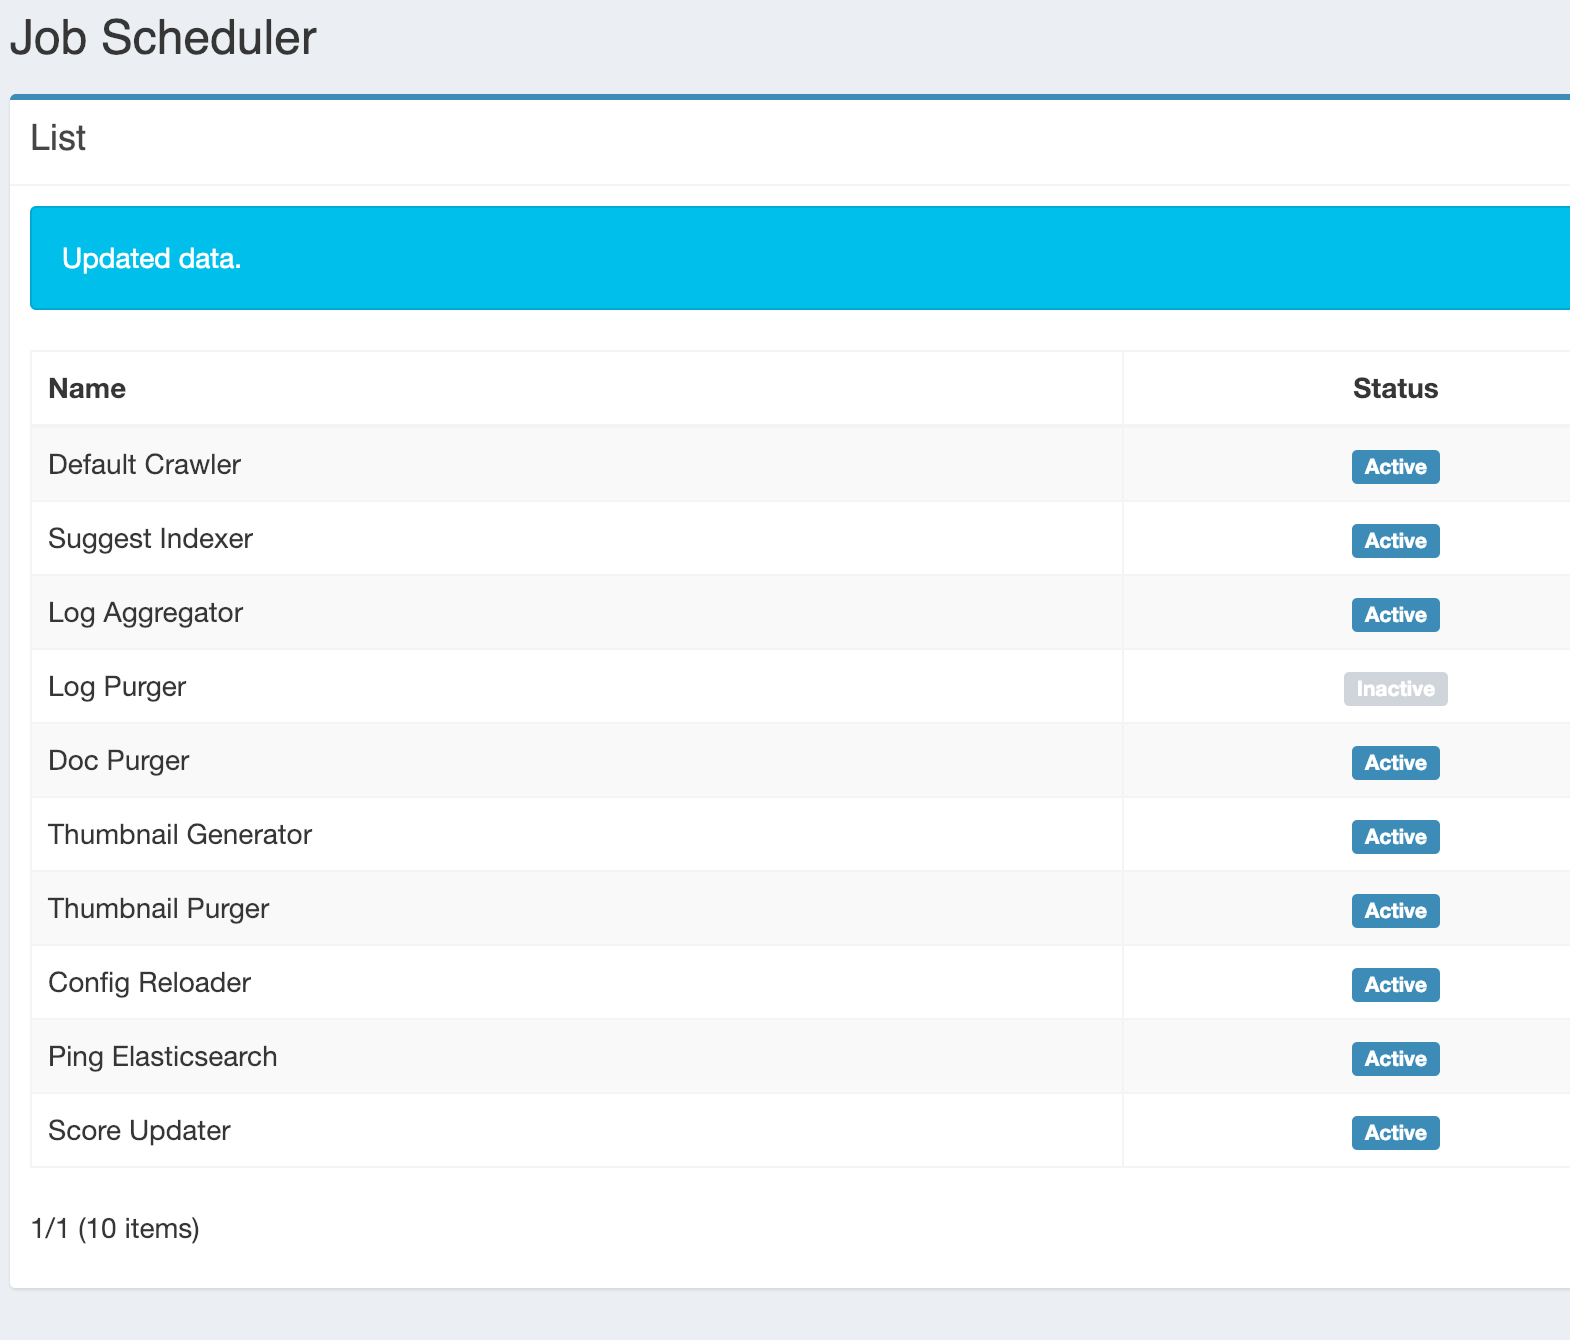
Default Crawler shows as Running in System > Scheduling but no new crawling events and documents added to index, only this in logs now:
2019-01-28 21:28:01,310 [CoreLib-TimeoutManager] INFO  [SYSTEM MONITOR] {"os":{"memory":{"physical":{"free":15566577664,"total":33359687680},"swap_space":{"free":0,"total":0}},"cpu":{"percent":1},"load_averages":[0.0, 0.16, 1.22]},"process":{"file_descriptor":{"open":373,"max":65535},"cpu":{"percent":0,"total":387190},"virtual_memory":{"total":5500514304}},"jvm":{"memory":{"heap":{"used":310984328,"committed":514654208,"max":518979584,"percent":59},"non_heap":{"used":144869488,"committed":158670848}},"pools":{"direct":{"count":40,"used":85999617,"capacity":85999616},"mapped":{"count":0,"used":0,"capacity":0}},"gc":{"young":{"count":422,"time":3118},"old":{"count":17,"time":882}},"threads":{"count":103,"peak":104},"classes":{"loaded":13002,"total_loaded":14178,"unloaded":1176},"uptime":2226970},"elasticsearch":null,"timestamp":1548710881310}
2019-01-28 21:28:08,734 [IndexUpdater] INFO  Processing no docs (Doc:{access 3ms, cleanup 11ms}, Mem:{used 300MB, heap 490MB, max 494MB})
2019-01-28 21:28:18,733 [IndexUpdater] INFO  Processing no docs (Doc:{access 2ms, cleanup 11ms}, Mem:{used 304MB, heap 490MB, max 494MB})
2019-01-28 21:28:28,733 [IndexUpdater] INFO  Processing no docs (Doc:{access 2ms, cleanup 11ms}, Mem:{used 308MB, heap 490MB, max 494MB})
2019-01-28 21:28:38,733 [IndexUpdater] INFO  Processing no docs (Doc:{access 2ms, cleanup 11ms}, Mem:{used 312MB, heap 490MB, max 494MB})
2019-01-28 21:28:48,733 [IndexUpdater] INFO  Processing no docs (Doc:{access 2ms, cleanup 11ms}, Mem:{used 316MB, heap 490MB, max 494MB})
2019-01-28 21:28:58,733 [IndexUpdater] INFO  Processing no docs (Doc:{access 2ms, cleanup 11ms}, Mem:{used 320MB, heap 490MB, max 494MB})
2019-01-28 21:29:01,337 [CoreLib-TimeoutManager] INFO  [SYSTEM MONITOR] {"os":{"memory":{"physical":{"free":15565189120,"total":33359687680},"swap_space":{"free":0,"total":0}},"cpu":{"percent":1},"load_averages":[0.0, 0.13, 1.14]},"process":{"file_descriptor":{"open":373,"max":65535},"cpu":{"percent":0,"total":388230},"virtual_memory":{"total":5500514304}},"jvm":{"memory":{"heap":{"used":337573088,"committed":514654208,"max":518979584,"percent":65},"non_heap":{"used":144861360,"committed":158670848}},"pools":{"direct":{"count":40,"used":85999617,"capacity":85999616},"mapped":{"count":0,"used":0,"capacity":0}},"gc":{"young":{"count":422,"time":3118},"old":{"count":17,"time":882}},"threads":{"count":103,"peak":104},"classes":{"loaded":13002,"total_loaded":14178,"unloaded":1176},"uptime":2286997},"elasticsearch":null,"timestamp":1548710941337}
2019-01-28 21:29:08,733 [IndexUpdater] INFO  Processing no docs (Doc:{access 2ms, cleanup 11ms}, Mem:{used 325MB, heap 490MB, max 494MB})
I appreciate your help so much, please let me fix this. There may be something else small that needs to be fixed? Do you want me to remove all indexes, restart elastic and recreate crawers?
(from github.com/marevol)
Disable Check Laste Modified flag.
(from github.com/abolotnov)
Ok, disabled this in General config, restarted the Default Crawler job. Will report.
(from github.com/abolotnov)
It worked for a little bit and stopped crawling again:
2019-01-28 22:10:28,840 [CoreLib-TimeoutManager] INFO  [SYSTEM MONITOR] {"os":{"memory":{"physical":{"free":14454079488,"total":33359687680},"swap_space":{"free":0,"total":0}},"cpu":{"percent":1},"load_averages":[0.0, 0.21, 1.25]},"process":{"file_descriptor":{"open":373,"max":65535},"cpu":{"percent":0,"total":367530},"virtual_memory":{"total":5502623744}},"jvm":{"memory":{"heap":{"used":308023528,"committed":518979584,"max":518979584,"percent":59},"non_heap":{"used":145401592,"committed":159129600}},"pools":{"direct":{"count":40,"used":85999617,"capacity":85999616},"mapped":{"count":0,"used":0,"capacity":0}},"gc":{"young":{"count":417,"time":3188},"old":{"count":19,"time":1227}},"threads":{"count":103,"peak":104},"classes":{"loaded":13015,"total_loaded":14199,"unloaded":1184},"uptime":1986435},"elasticsearch":null,"timestamp":1548713428840}
2019-01-28 22:10:31,115 [IndexUpdater] INFO  Processing no docs (Doc:{access 2ms, cleanup 9ms}, Mem:{used 296MB, heap 494MB, max 494MB})
2019-01-28 22:10:41,116 [IndexUpdater] INFO  Processing no docs (Doc:{access 3ms, cleanup 9ms}, Mem:{used 299MB, heap 494MB, max 494MB})
2019-01-28 22:10:51,115 [IndexUpdater] INFO  Processing no docs (Doc:{access 2ms, cleanup 9ms}, Mem:{used 303MB, heap 494MB, max 494MB})
2019-01-28 22:11:01,115 [IndexUpdater] INFO  Processing no docs (Doc:{access 2ms, cleanup 9ms}, Mem:{used 307MB, heap 494MB, max 494MB})
2019-01-28 22:11:11,116 [IndexUpdater] INFO  Processing no docs (Doc:{access 3ms, cleanup 9ms}, Mem:{used 312MB, heap 494MB, max 494MB})
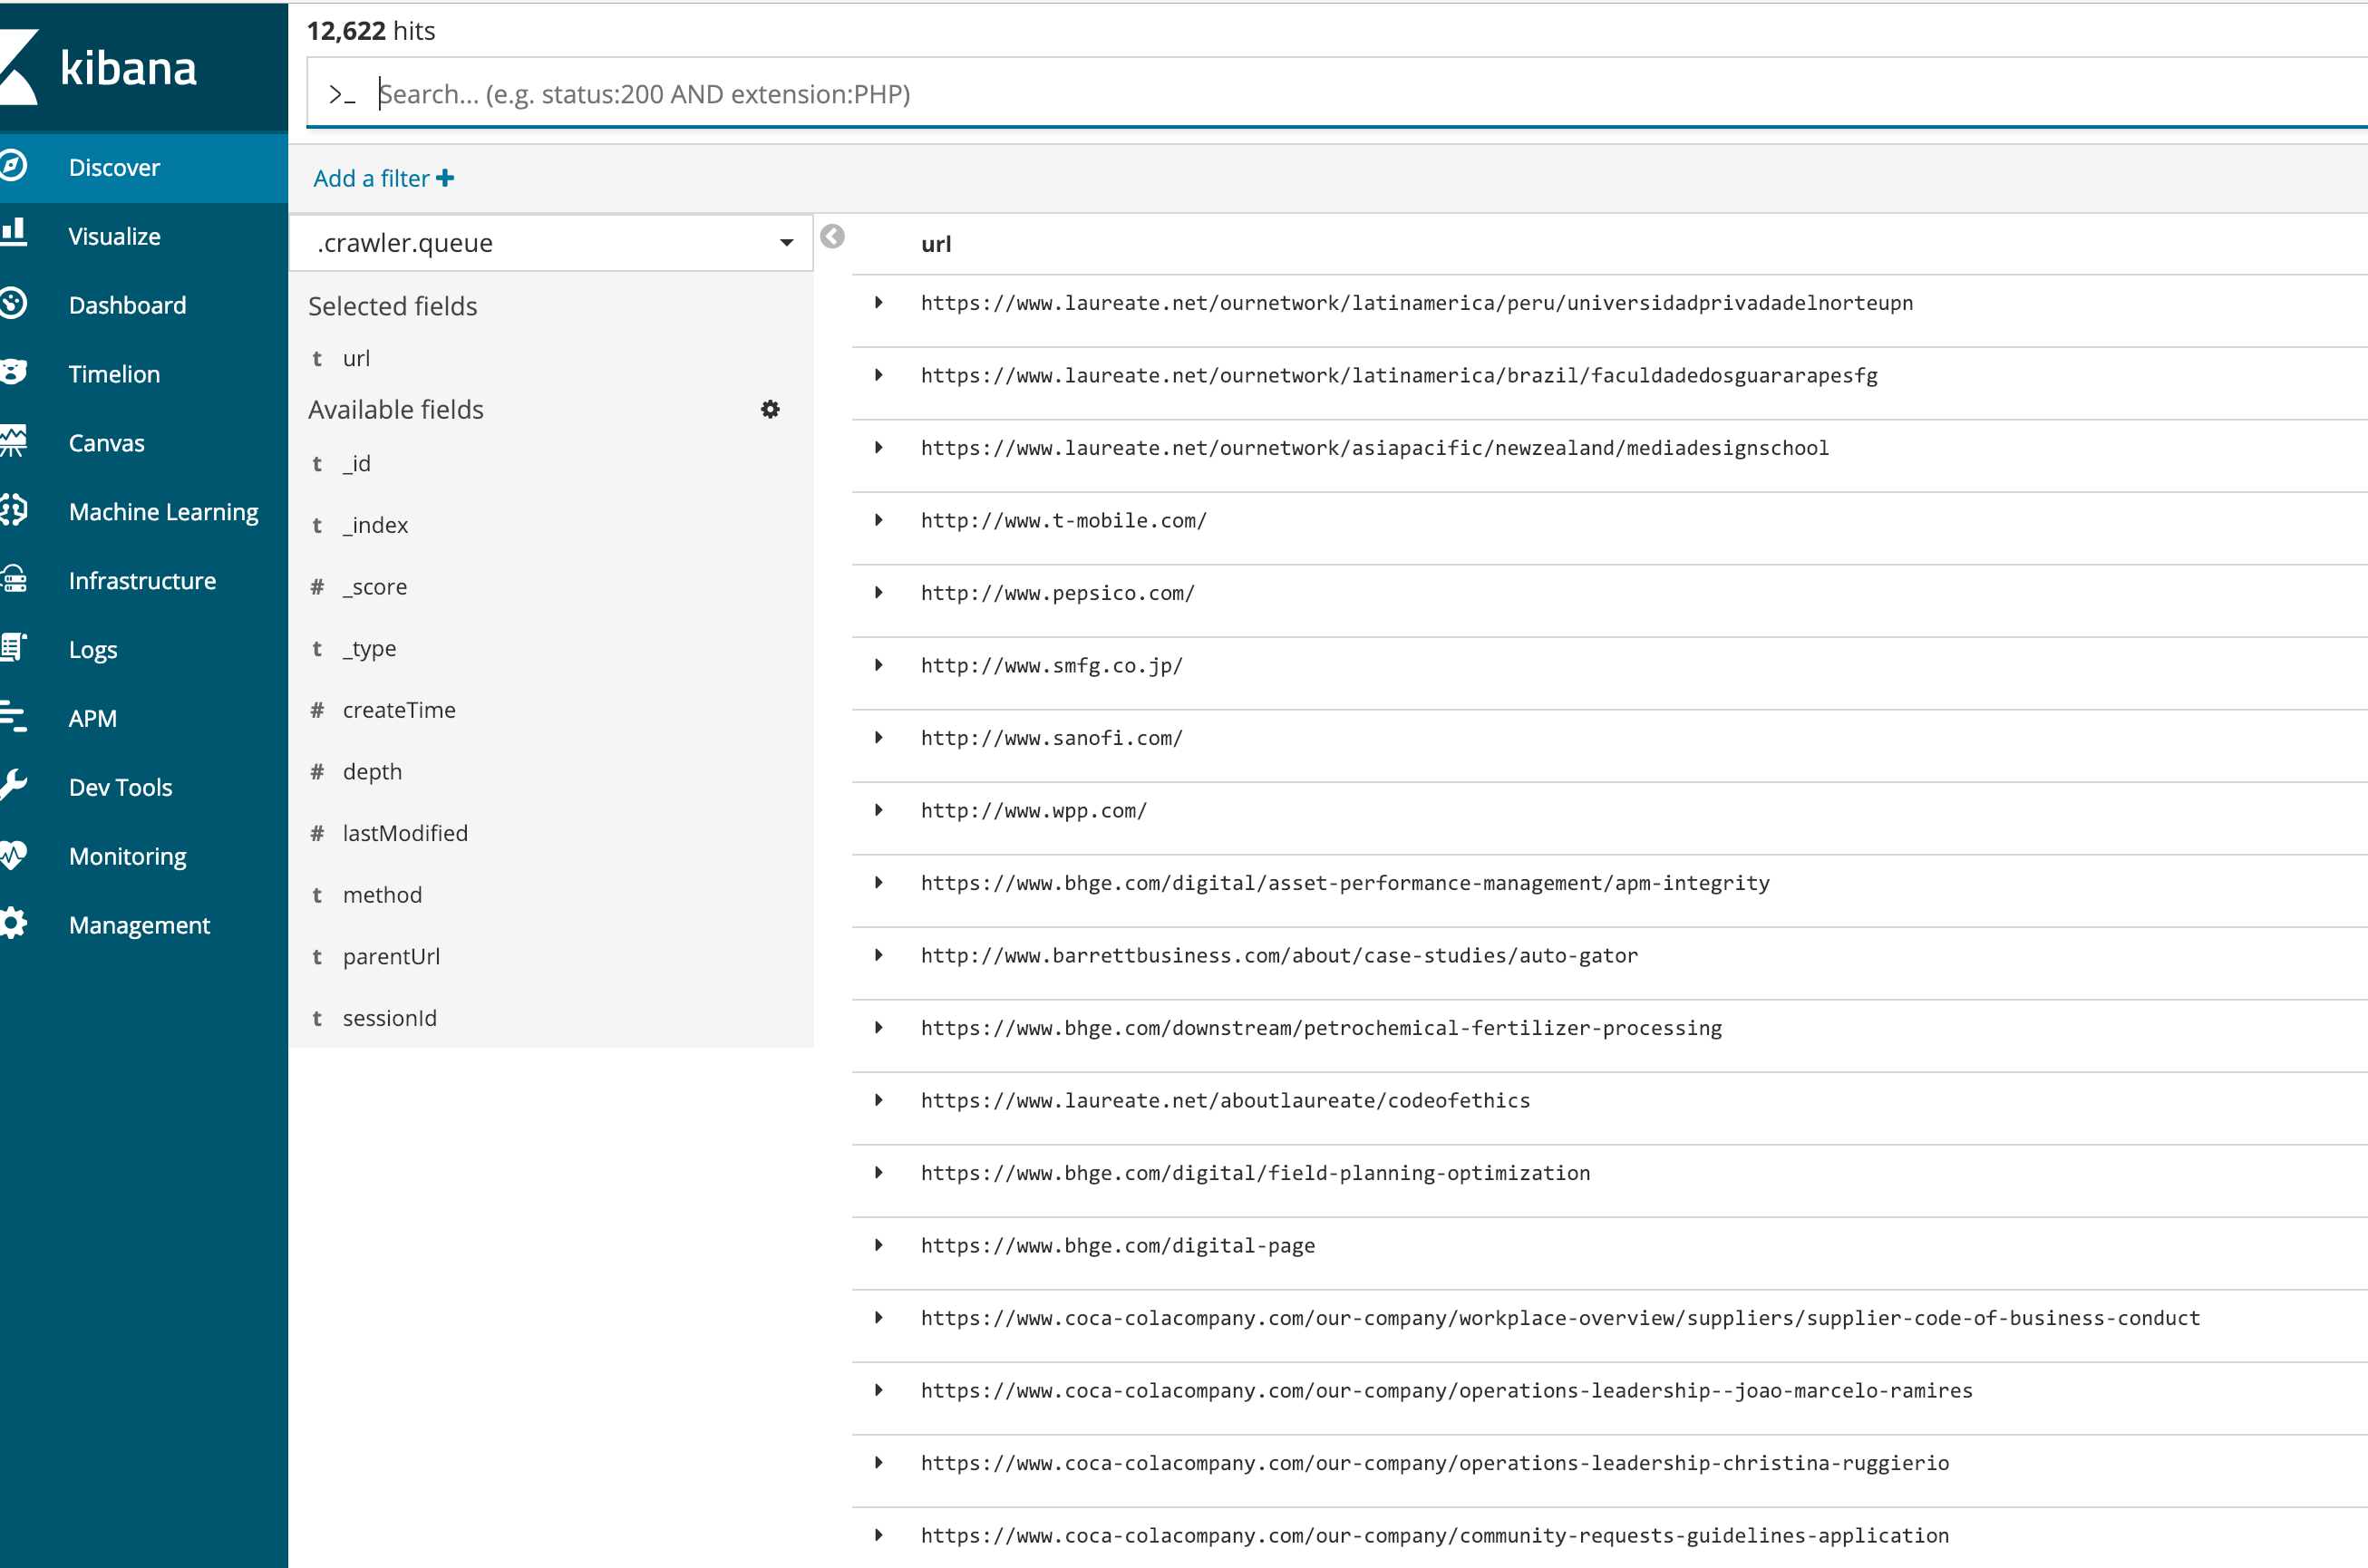
There are over 4K objects in the .crawler.queue index, too - the number hasn’t changed for some time, too. 30 minutes ago it was over 7K and now froze at 4K.
(from github.com/marevol)
Need more details…
Fess has many settings in fess_config.properties or the like to apply it to several situations.
You can check source code to change them, or contact Commercial Support if you need more supports.
(from github.com/abolotnov)
What kind of details do you want me to give you? At this point, I tried three times with clean install and enabled debug logging, so plenty of logging.
I think this is a defect, not a configuration issue: at this point, I only loaded 300 sites, they all got picked up by the crawler but eventually, after some time, the crawling activity stopped. I have 87 item in the .crawler.queue that are just sitting there. The default crawler is running on the scheduler page but there is no crawling/document indexing activity.
re commercial support - I’d probably get this at some point to help with a few things that I am missing in FESS. But while evaluating if I want to use FESS in the first, not being able to solve a very fundamental issue (where crawlers don’t crawl all of the sites registered with it) and having to go to commercial support for this is probably a bit of a stretch.
I can further help find the issue and fix it if you are interested in making sure it’s working properly. Am I the only guy trying to use FESS for a large number of sites? It may be helpful for the project to use my usecase to fix an issue or two.
(from github.com/abolotnov)
Ok so as I mentioned earlier, I did another clean install on AWS, 4.15.0-1021-aws #21-Ubuntu SMP Tue Aug 28 10:23:07 UTC 2018 x86_64 x86_64 x86_64 GNU/Linux instance with 8 vCPU and 16G RAM.
Installed as per instructions:
mkdir tmp && cd tmp
wget https://github.com/codelibs/fess/releases/download/fess-12.4.3/fess-12.4.3.deb
wget https://artifacts.elastic.co/downloads/kibana/kibana-6.5.4-amd64.deb
wget https://artifacts.elastic.co/downloads/elasticsearch/elasticsearch-6.5.4.deb
sudo apt-get update
sudo apt-get install openjdk-8-jre
sudo apt install ./elasticsearch-6.5.4.deb
sudo apt-get install ./kibana-6.5.4-amd64.deb
sudo apt install ./fess-12.4.3.deb
sudo nano /etc/elasticsearch/elasticsearch.yml
   ^ added configsync.config_path: /var/lib/elasticsearch/config
sudo nano /etc/elasticsearch/jvm.options
   ^ added memory
 sudo nano /etc/kibana/kibana.yml
   ^ added nonloopback to access externally
sudo /usr/share/elasticsearch/bin/elasticsearch-plugin install org.codelibs:elasticsearch-analysis-fess:6.5.0
sudo /usr/share/elasticsearch/bin/elasticsearch-plugin install org.codelibs:elasticsearch-analysis-extension:6.5.1
sudo /usr/share/elasticsearch/bin/elasticsearch-plugin install org.codelibs:elasticsearch-analysis-extension:6.5.1
sudo /usr/share/elasticsearch/bin/elasticsearch-plugin install org.codelibs:elasticsearch-configsync:6.5.0
sudo /usr/share/elasticsearch/bin/elasticsearch-plugin install org.codelibs:elasticsearch-dataformat:6.5.0
sudo /usr/share/elasticsearch/bin/elasticsearch-plugin install org.codelibs:elasticsearch-langfield:6.5.0
sudo /usr/share/elasticsearch/bin/elasticsearch-plugin install org.codelibs:elasticsearch-minhash:6.5.0
sudo /usr/share/elasticsearch/bin/elasticsearch-plugin install org.codelibs:elasticsearch-learning-to-rank:6.5.0
sudo service elasticsearch start
sudo service kibana start
sudo service fess start
then I change the page.web.config.max.fetch.size setting to 10000 and increase a couple of other figures.
After that I create web crawlers via rest api, like this:
data_template = """{
    \"name\": \"%name%\",
    \"urls\": %url%,
    \"included_urls\": %included%,
    \"excluded_urls\": \".*\\\\.gif .*\\\\.jpg .*\\\\.jpeg .*\\\\.jpe .*\\\\.pcx .*\\\\.png .*\\\\.tiff .*\\\\.bmp .*\\\\.ics .*\\\\.msg .*\\\\.css .*\\\\.js\",
    "user_agent": "Mozilla/5.0 (Windows NT 10.0; WOW64) AppleWebKit/537.36 (KHTML, like Gecko) Chrome/70.0.3538.67 Safari/537.36",
    \"num_of_thread\": 8,
    \"interval_time\": 10,
    \"sort_order\": 1,
    \"boost\": 1.0,
    \"available\": \"True\",
    \"permissions\": \"{role}guest\",
    \"depth\": 5,
    \"max_access_count\": 12
    }

bearer_token = 'cXq6gk8tiq8xYJP7T7pBgq0K7tsv761Sbt544ElQomYrHkm7mzfCnjPn7GQv'
r_header = {'Authorization': 'Bearer {}'.format(bearer_token), 'Content-type': 'application/json'}
r_url = 'http://35.163.6.168:8080/api/admin/webconfig/setting'

orgs_to_index = models.Organization.objects.filter(website__startswith='http://')[0:300]
for o in orgs_to_index:
    payload = data_template.replace('%name%', o.symbol).replace('%url%', url_name_enhancer(o.website)).replace('%included%', url_included_enhancer(o.website))
    outcome = requests.put(url=r_url, data=payload, headers=r_header)
    try:
        crawler_id = json.loads(outcome.text)['response']['id']
        o.elastic_config_id = crawler_id
        o.save()
    except Exception as e:
        print(e)
At this point, the web configs will show in FESS UI, too. Here’s one from Elastic index:
{
  "_index": ".fess_config.web_config",
  "_type": "web_config",
  "_id": "GIkHl2gBC0KNaBG5Jso_",
  "_version": 1,
  "_score": 1,
  "_source": {
    "updatedTime": 1548722054718,
    "includedUrls": "http://www.berkshirehathaway.com/.* \n https://www.berkshirehathaway.com/.*",
    "virtualHosts": [],
    "updatedBy": "guest",
    "excludedUrls": ".*\\.gif .*\\.jpg .*\\.jpeg .*\\.jpe .*\\.pcx .*\\.png .*\\.tiff .*\\.bmp .*\\.ics .*\\.msg .*\\.css .*\\.js",
    "available": true,
    "maxAccessCount": 12,
    "userAgent": "Mozilla/5.0 (Windows NT 10.0; WOW64) AppleWebKit/537.36 (KHTML, like Gecko) Chrome/70.0.3538.67 Safari/537.36",
    "numOfThread": 8,
    "urls": "http://www.berkshirehathaway.com/ \n https://www.berkshirehathaway.com/",
    "depth": 5,
    "createdBy": "guest",
    "permissions": [
      "Rguest"
    ],
    "sortOrder": 1,
    "name": "BRK.B",
    "createdTime": 1548722054718,
    "boost": 1,
    "intervalTime": 10
  }
}
so at this point, the only couple things I go:
debug logging in general settingscheck last modify
Similar to few other times I did this, the symptoms are very similar:
_
FESS will stop crawling at some point. Farthest I got was 162 sites. the crawling queue at this point has 72 sites. The Scheduler page is showing default crawler as running.
_
It basically just stops crawling without saying anything and looks like the crawling job is handing there endlessly. I will leave it like this overnight but I am pretty positive it’s not going to finish.
I copied the logs and essential configs here: https://www.dropbox.com/sh/ci7yfu5pbv7xa8v/AACmREoBf9Cc9GLgA7dyGUDYa?dl=0
Let me know if there is anything else in terms of “more info” that I could supply. I am about to give up.
(from marevol (Shinsuke Sugaya) · GitHub)
“more info” is steps to reproduce it.
2019-01-29 01:19:25,945 [Crawler-20190129003919-213-1] INFO Checking URL: http://www.oreillyauto.com/robots.txt
The above access seems to be brocked.
To apply a debug level logging on crawler, change logLevel to debug for Default Crawler in Scheduler.
(from github.com/abolotnov)
I gave you the exact steps, including commands and the list of crawlers that I use to reproduce this. I am happy to provide more data, let me know what exactly.
Overnight I see there are about 12,000 objects in the .crawler_queue (were 72 6 hours ago). So I see the list has grown. Default crawler is shown as Active in he Scheduling page.
I have changed the logging for the default crawler to debug, do you want me to start this?
But I think the question is: Why does not the default crawler run when there are remaining items in the crawling queue?
(from marevol (Shinsuke Sugaya) · GitHub)
Why does not the default crawler run when there are remaining items in the crawling queue?
You set maxAccessCount to 12 to stop crawling.
For Fess user I know, https://www.chizen.jp/ crawls massive sites. It’s like Google.
(from github.com/abolotnov)
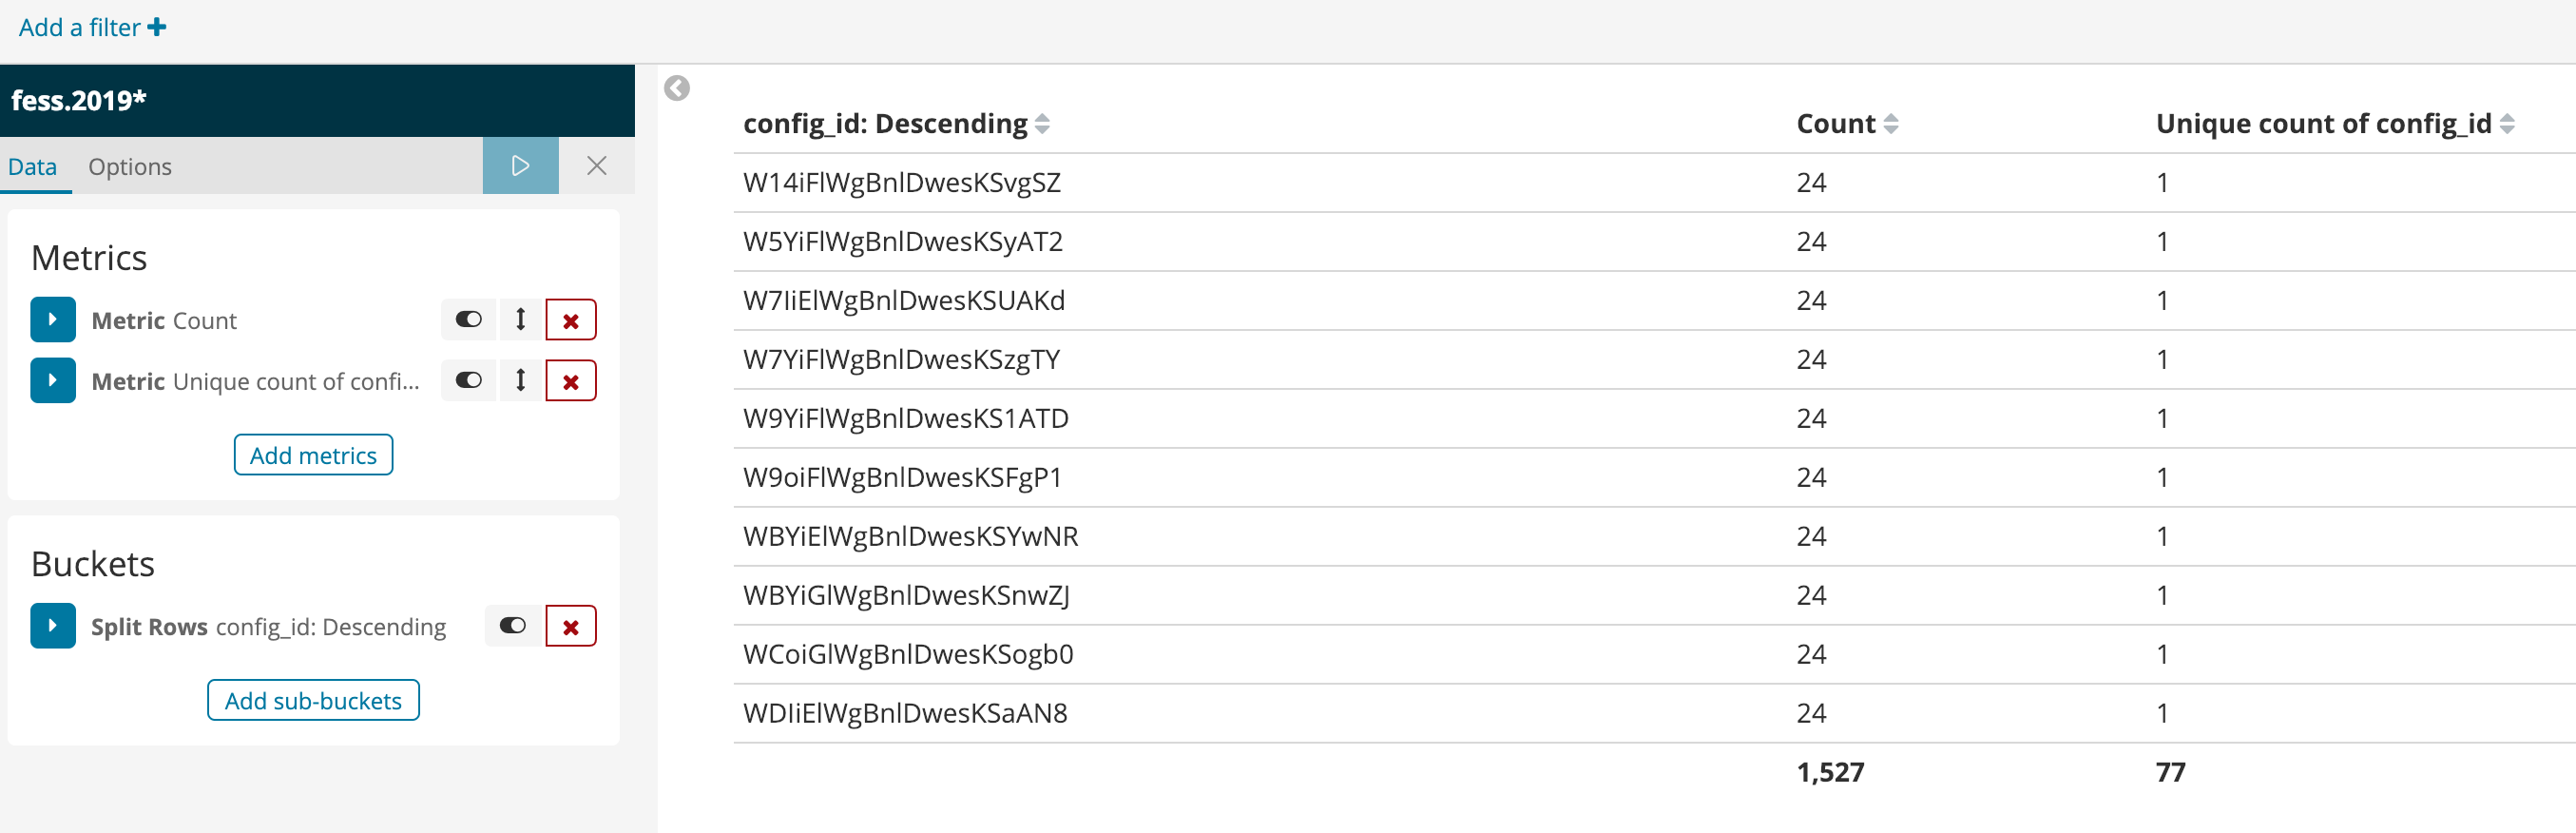
the maxAccessCount in the WebCrawler controls how many documents will be indexed for a particular site. It does not mean that it will only crawl 12 pages for all the crawlers. At this this is how I understand this. Let me know if my understanding is wrong.
Now, when I crawl a single site or 10 sites and regardless of the maxAccessCount setting, it will work just fine. I tried one site unlimited and it did it well. My difference from many other use cases is that I seem to crawl many individual sites. I need to do 8K but can’t get it to finish 300.
(from github.com/marevol)
The crawling queue is just a queue to crawl URLs.
.crawler* indices are a meta index to crawl documents, not for document search.
So, you should check the blocked access in fess-crawler.log with debug logging.
(from github.com/abolotnov)
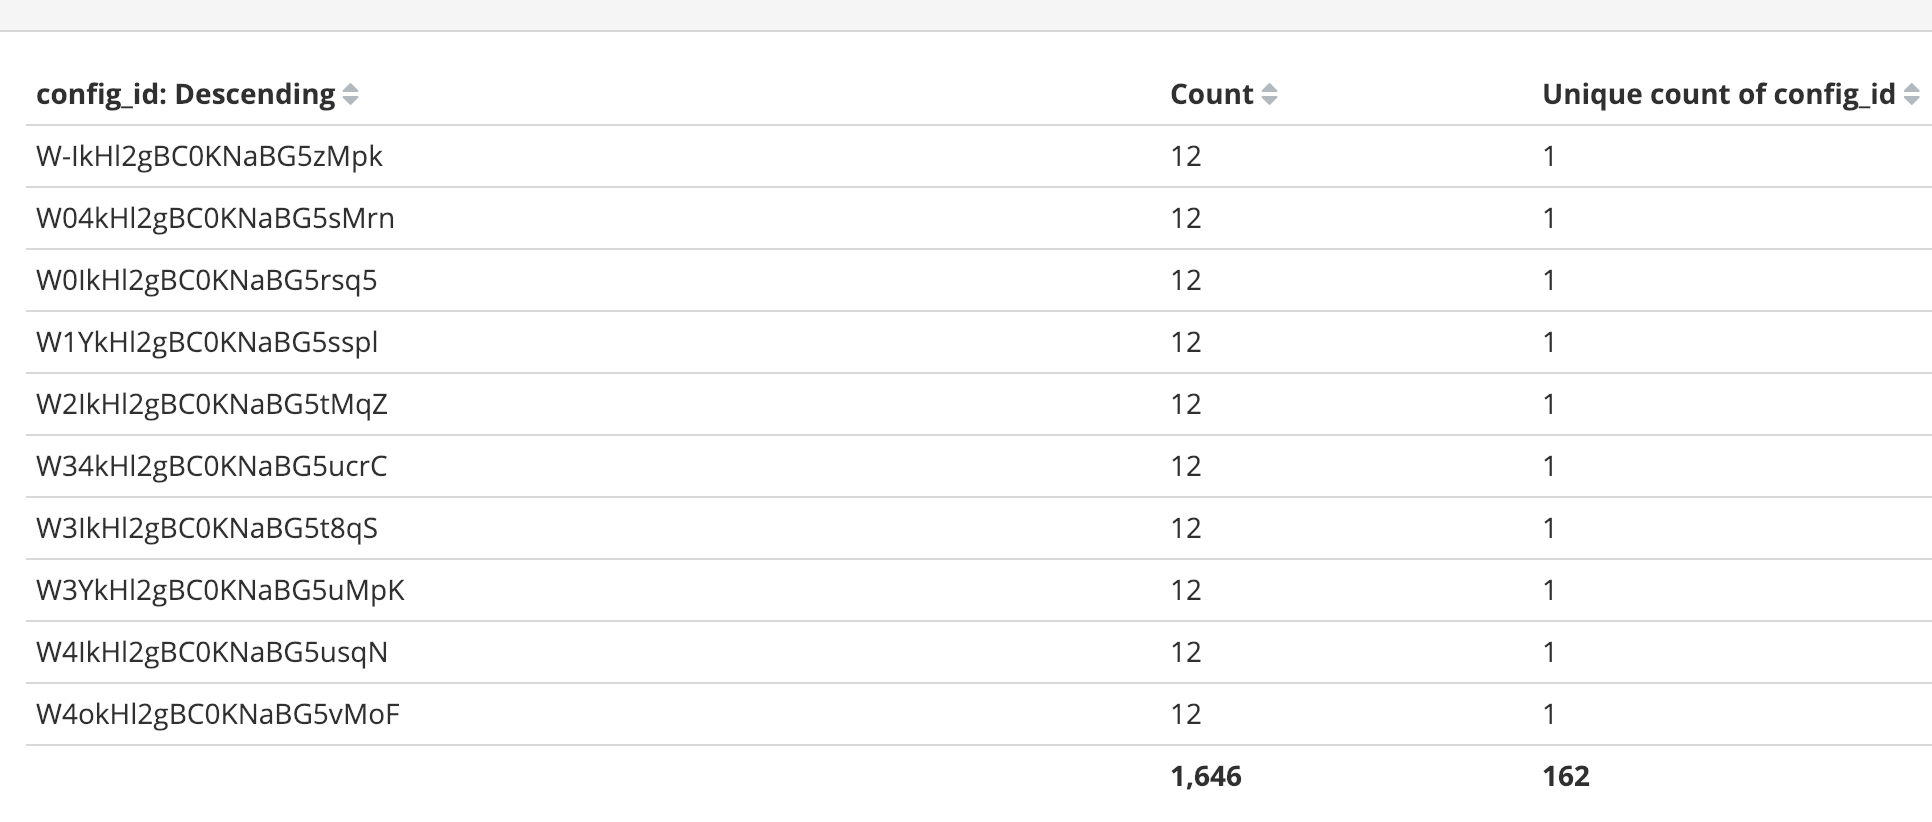
I understand this. My expectation was that if I created 300 web crawlers and 12 maxAccessCount for each, I would end up with 300*12 documents in the index. And this is how much it’s done for this 162 sites out of 300.
My understanding was that the default crawler will not stop crawling until the crawl_queue is not empty. For the failed URLs - once a URL failed, it will remove that URL from the queue and proceed with other URLs right?
Ok, I enabled debug mode and will start the crawler now.
(from github.com/abolotnov)
ok I started the default crawler, there are 14,000 URLs in the queue. Is my assertion right that the crawler should run until the queue is empty?
(from github.com/abolotnov)
There are 150K items in the queue now.
© 2020. All Rights Reserved - CodeLibs, Inc.