I have two different machines with FSS. I have configured the first one a while ago, and it’s working good - search works, index is great and no complaints. This is the prototype machine.
Now we’re working on bringing it into production. The number of documents is the same as on the first machine. I’m doing the same config for the crawler and for the scheduler as before.
The only differences from the first prototype are:
- Now we use containerized Fess and Elastic.
- FSS/ES version is different. Prototype version is Fess 13.13/Production version is Fess 14. ES version is correspondent to the Fess version.
So I created a web crawler like this on prototype:
ID	MJ_QYnsB9dIUQ_BFDsig
Name	Crawl-site
URLs	http://doc-online.vdv.digdes.com:5000/
Included URLs For Crawling	http://doc-online.vdv.digdes.com:5000/.*
Excluded URLs For Crawling
Included URLs For Indexing	http://doc-online.vdv.digdes.com:5000/.*
Excluded URLs For Indexing
Config Parameters
Depth	10000
Max Access Count	1000000000
User Agent	Mozilla/5.0 (compatible; Fess/13.13; +http://fess.codelibs.org/bot.html)
The number of Thread	1
Interval time	10000 ms
Boost	1.0
Permissions	{role}guest
Virtual Hosts
Status	Enabled
Description
Web crawler is basically identical for the two machines. Here is production:
ID	b6E7UIABlQ8vqNDZB1bW
Name	Crawl-site
URLs	http://help.docsvision.com/
Included URLs For Crawling	http://help.docsvision.com/.*
Excluded URLs For Crawling
Included URLs For Indexing	http://help.docsvision.com/.*
Excluded URLs For Indexing
Config Parameters
Depth	10000
Max Access Count	1000000000
User Agent	Mozilla/5.0 (compatible; Fess/14.0; +http://fess.codelibs.org/bot.html)
The number of Thread	1
Interval time	10000 ms
Boost	1.0
Permissions	{role}guest
Virtual Hosts
Status	Enabled
Description
The scheduler is different:
Prototype:
Name	Default Crawler
Target	all
Schedule	*/5 * * * *
Executor	groovy
Script	return container.getComponent("crawlJob").logLevel("debug").sessionId("MJ_QYnsB9dIUQ_BFDsig").webConfigIds(["MJ_QYnsB9dIUQ_BFDsig"] as String[]).fileConfigIds([] as String[]).dataConfigIds([] as String[]).jobExecutor(executor).execute();
Logging	Enabled
Crawler Job	Enabled
Status	Enabled
Display Order	1
Production has default configuration for scheduler job:
Name	Default Crawler
Target	all
Schedule	0 0 * * *
Executor	groovy
Script	return container.getComponent("crawlJob").logLevel("info").gcLogging().execute(executor);
Logging	Enabled
Crawler Job	Enabled
Status	Enabled
Display Order	1
It does index something, but I remember that default script was returning very little results on the prototype. So I took the config from prototype and ported it to the production:
Name	Default Crawler
Target	all
Schedule	*/5 * * * *
Executor	groovy
Script	return container.getComponent("crawlJob").logLevel("debug").sessionId("b6E7UIABlQ8vqNDZB1bW").webConfigIds(["b6E7UIABlQ8vqNDZB1bW"] as String[]).fileConfigIds([] as String[]).dataConfigIds([] as String[]).jobExecutor(executor).execute();
Logging	Enabled
Crawler Job	Enabled
Status	Enabled
Display Order	1
We let the production index the docs overnight, it indexed about 14 thousand docs. Prototype has about 42 thousand docs indexed.
The issues are the following:
- Indexing on the production is very slow.
- Even though production indexed about 14 thousand docs, it still didn’t find anything. No search results, not even a single one.
So we started a clean configuration for production.
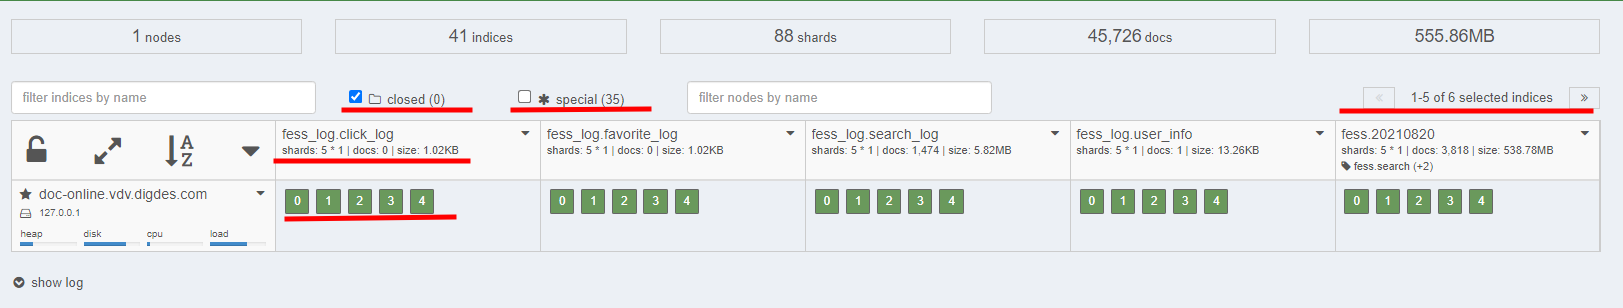
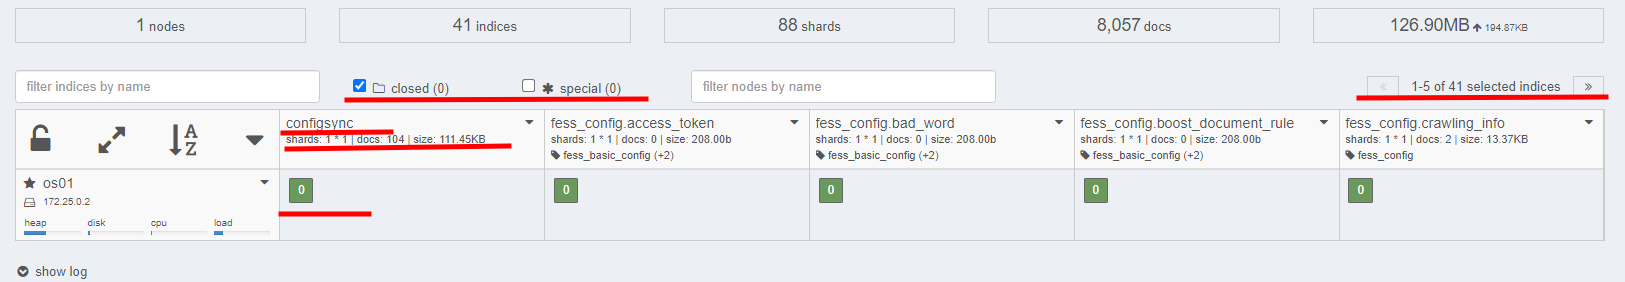
I know nothing about Fess or ES configuration, so I am asking for help here on the forum. From the dashboard, it looks like the production hasn’t configured properly. Here are screenshots from production dashboard:
And here are screenshots from the prototype dashboard:
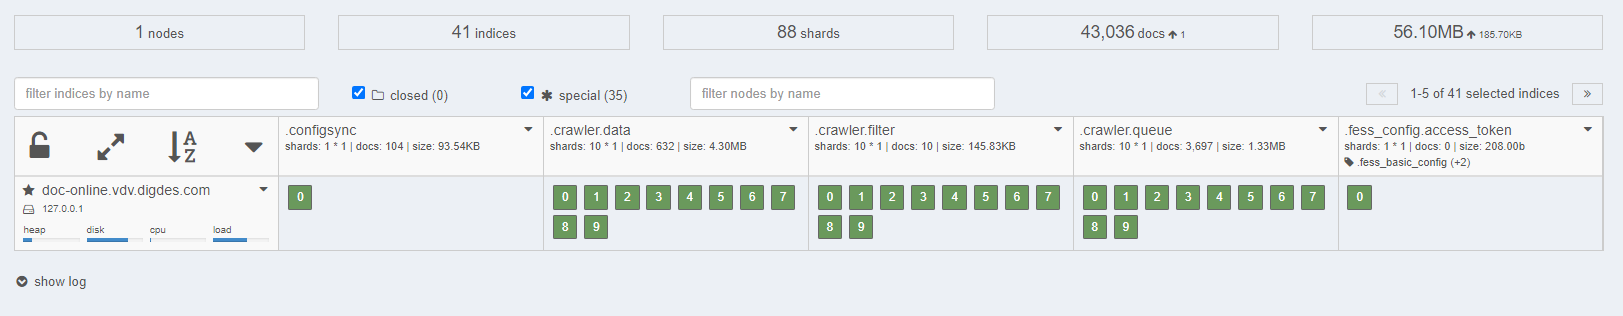
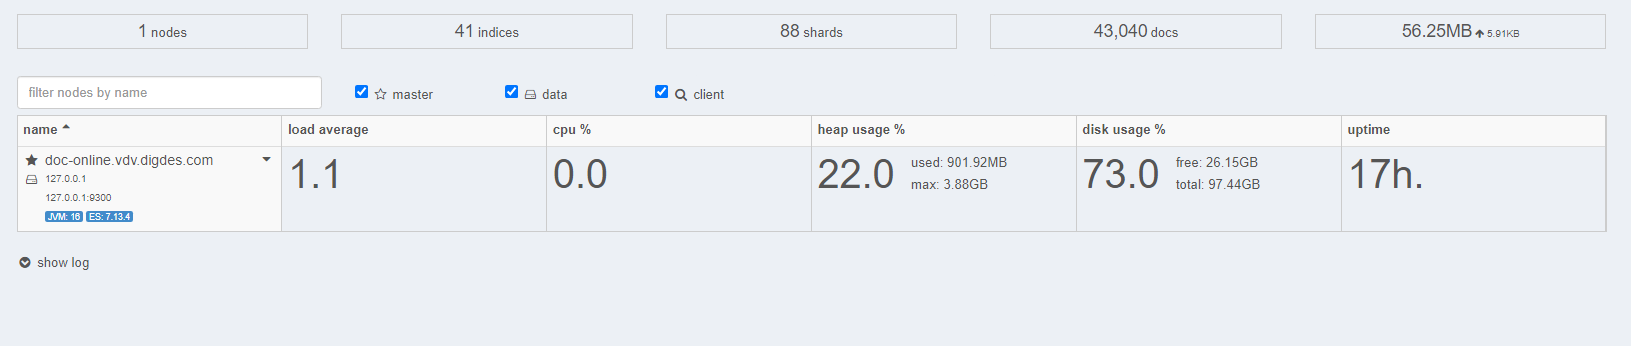
Prototype looks healthier, and I don’t really know why. Could that be because of the containers or because of newer version of FSS/ES? Or maybe something else? I would appreciate if someone pointed the direction of the problem.